Stage 3 of the solar upgrade wasn’t supposed to be dramatic.
In theory, it was just a mechanical improvement: fabricate tilt brackets for the four 100‑watt panels, rewire them in a cleaner series/parallel configuration, and give them the same fighting chance the larger arrays already had.
What actually happened was far more interesting.
Those four little 100‑watt panels — the ones that had been sitting in fourth place since the beginning of this project — suddenly woke up, stretched their legs, and sprinted past every other array in the system. With tilt and proper wiring, the smallest array became the top producer.
Sometimes the simplest upgrade is the one that changes everything.
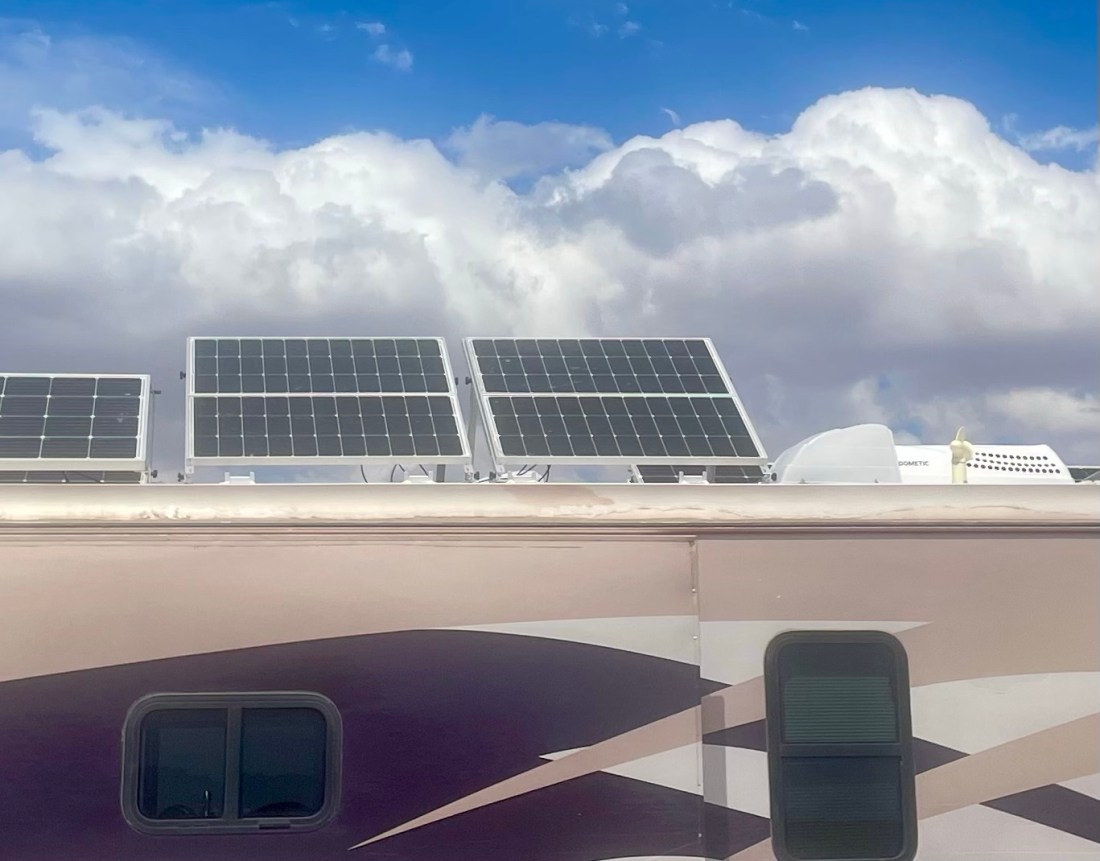
The Tilt Brackets That Made It Possible
After hunting for aluminum stock and hardware to fabricate my own tilt system, I stumbled across a ready‑made solution: a set of adjustable 47″ RV solar tilt brackets. They were inexpensive, sturdy, and already engineered for the exact kind of RV roof mounting I needed.
Two sets were perfect for the 4×100 W array.
The remaining two sets will be trimmed and repurposed for the upcoming pair of 200‑watt panels.
For once, buying was cheaper — and better — than building.
Rewiring the Array: Series/Parallel Done Right
The original wiring on the 100‑watt panels was functional, but not optimized. With the brackets installed, I took the opportunity to reconfigure the array into a cleaner series/parallel layout. The result:
- Higher operating voltage
- Lower current losses
- Better MPPT tracking
- Cooler wiring
- A more stable power curve throughout the day
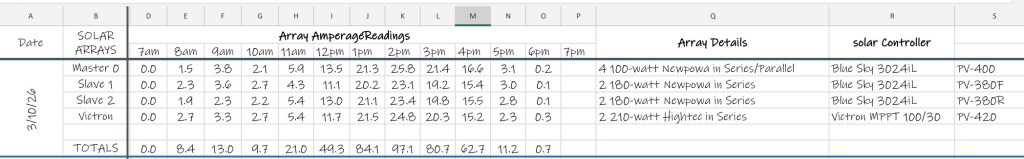
The Blue Sky controller doesn’t give individual array wattage, so I’ve been logging hourly amperage manually. The numbers don’t lie — the newly tilted array is outperforming the larger Victron‑controlled array by a noticeable margin.
This is the first time the “small” array has taken the lead since the project began.
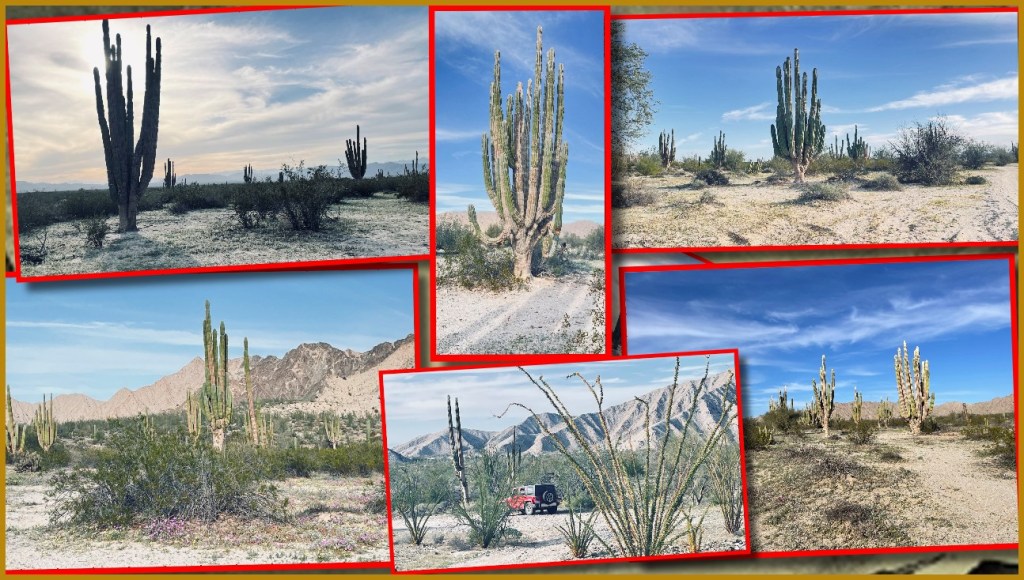
Real‑World Results: March Sun in the Desert
We wrapped up Stage 3 just as we moved from Winterhaven, CA to the BLM land at Pump Station near Marana, Arizona. The timing couldn’t have been better.
On March 3rd, with 1,540 watts of total solar installed, the system harvested 7.69 kWh — a strong number for early March and a clear sign that the tilt upgrade is paying off.
For planning purposes, I’ve extended my expected Peak Sun Hours (PSH) to 6.1 for the first week of March in Marana. Based on latitude, sun angle, and the performance I’m seeing, that’s a realistic and conservative number.
The desert sun is doing its part. The panels are finally doing theirs.
Declaring Stage 3 Complete!
Stage 3 wasn’t about adding more watts — it was about unlocking the watts I already had. With the tilt brackets installed, the wiring cleaned up, and the array now punching far above its weight, I can officially call Stage 3 complete.
Next up:
Stage 4 — Adding the new 200‑watt panels and integrating surplus‑solar automation for the water heater.
The system is evolving from “solar‑assisted” to “solar‑driven,” and the numbers are finally matching the theory.
Day 3087