LTVA – Imperial Dam

🌵 Imperial Dam LTVA: The Ultimate Guide for Extended Desert Camping

Imperial Dam Long Term Visitor Area (LTVA) is one of the premier desert boondocking and snowbird camping areas in the Southwest. Managed by the Bureau of Land Management (BLM), this long-term visitor site sits near Yuma, Arizona / Winterhaven, California and offers a unique desert camping experience with access to lakes, river recreation, and iconic Southwestern views.


📍 Location & GPS Coordinates

  • Imperial Dam LTVA
  • Latitude: 32.901256
  • Longitude: -114.495431

This places it on the California side of the Colorado River, north of Yuma.
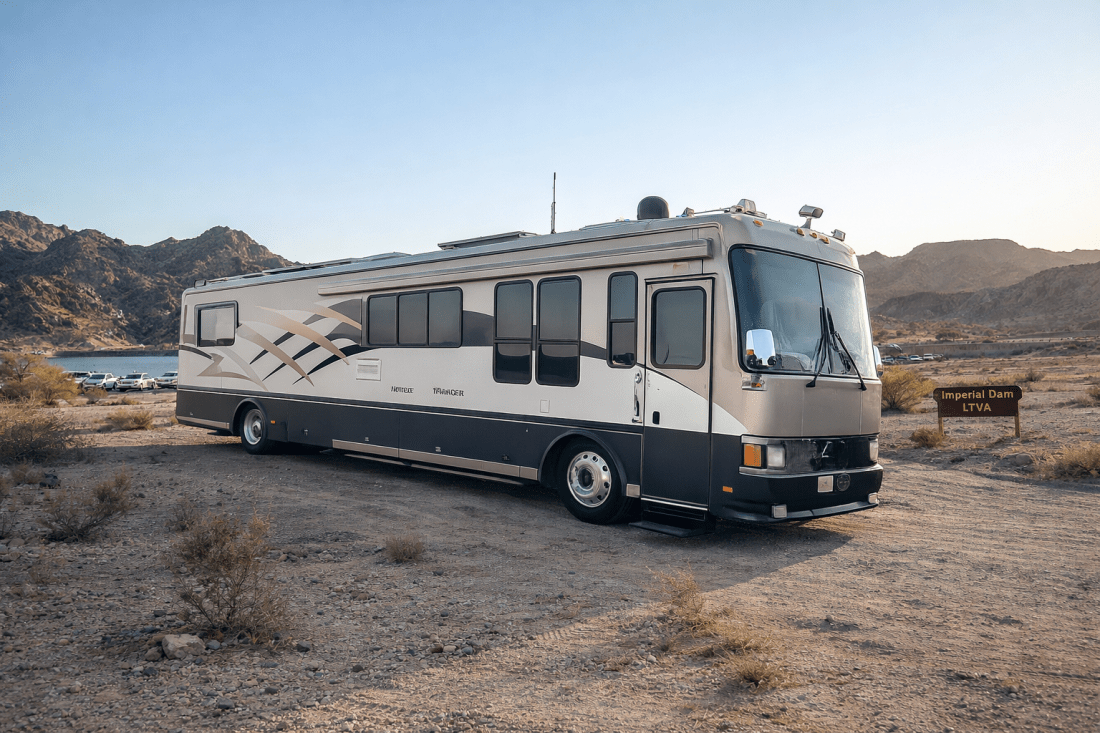

🏕️ What It’s Like

Imperial Dam LTVA covers roughly 3,500 acres of flat desert terrain — dotted with creosote bushes, palo verde, mesquite, ironwood trees, and native cacti typical of the Sonoran Desert. The landscape is mostly flat and open, which makes it ideal for RVs, tents, and boondocking with plenty of space between neighbors.


💦 Amenities at the Site

On-Site Services

  • Multiple dump stations (including black/grey water).
  • Several potable water stations.
  • Restrooms & outdoor showers near admin areas.
  • Trash dumpsters serviced regularly.
  • Ramadas and open day-use areas for shade.
  • Boat launch access & nearby fishing opportunities on lakes and the Colorado River.

⚠️ This is still primarily boondocking. Most individual campsites are not marked, and many do not have full hookups. Plan to be self-sufficient.


💰 Fees: Current (2025–26) & Projected

Running Season (Sep 15 – Apr 15)

  • Long-Term Permit: $180 — valid for up to 7 months anywhere in BLM’s LTVAs.
  • Short-Visit Permit: $40 — valid for 14 consecutive days (with unlimited renewals).

Off-Season (Apr 16 – Sep 14)

  • Day Use: $10/vehicle
  • Overnight: $15/vehicle
  • Annual Pass (vehicle): $75

🪪 Projected future changes: Fees historically remain stable; occasional minor increases are proposed by BLM business plans (subject to federal recreation fee reviews). No official 2026 fee increases published yet — check official BLM updates before planning.


☀️ Weather & Seasonal Temperatures

Imperial Dam sits in one of the sunniest, driest deserts in the U.S., near Yuma — frequently ranked among the most sunshine-filled cities.

🌤️ Fall (Sept – Nov)

  • Daytime: 80–100°F and cooling into the 80s by November.
  • Nights: Generally 60s–70s°F.
  • Great weather for hiking, boating, and outdoor activities.

❄️ Winter (Dec – Feb)

  • Highs: 60s–70s°F — mild and very popular with snowbirds.
  • Lows: 40s–50s°F at night.
  • Rare freezes — generally comfortable.

🌼 Spring (Mar – May)

  • Highs: 70s–90s°F early, warming into 90s by May.
  • Nights: 50s–60s°F.

☀️ Summer (Jun – Aug)

Very hot: highs often >100°Fnot recommended for long stays unless prepared for extreme heat.

Rainfall is minimal (around ~3″ annual), with some summer monsoon and occasional occasional storms in late summer.


🚗 How to Get There

From Interstate 8 (I-8)

  1. Take Exit 9 (S-24 / Yuma Road) north.
  2. Head north ~22 miles on S-24.
  3. Turn left onto Senator Wash Road.
  4. Continue ~2 miles to the Imperial Dam LTVA entrance.

From Interstate 10 (I-10)

  • Head south on US-95 toward Yuma, then turn right on Senator Wash Road and follow the directions above.

🧭 Nearby Attractions & Services

Outdoor Recreation

  • Imperial National Wildlife Refuge – unique birding/wildlife habitat close by.
  • Senator Wash Reservoir & Imperial Reservoir – fishing & paddling.

City Conveniences

  • Yuma, AZ – groceries, RV services, restaurants, medical, and entertainment. ~30–40 min drive.

📌 Tips for Campers

✔ Bring extra water and fuel — desert environment is remote.
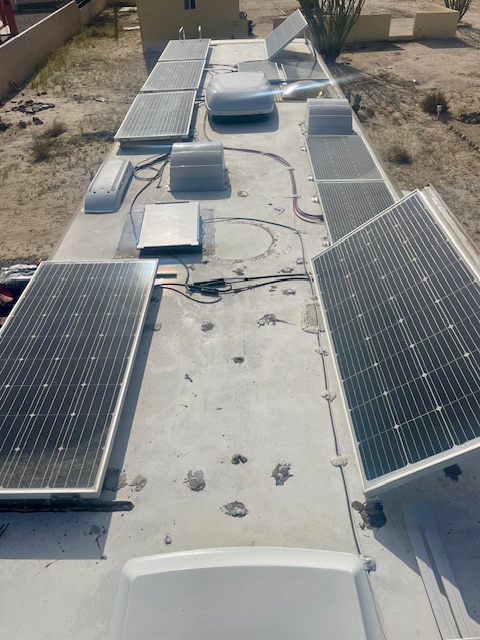
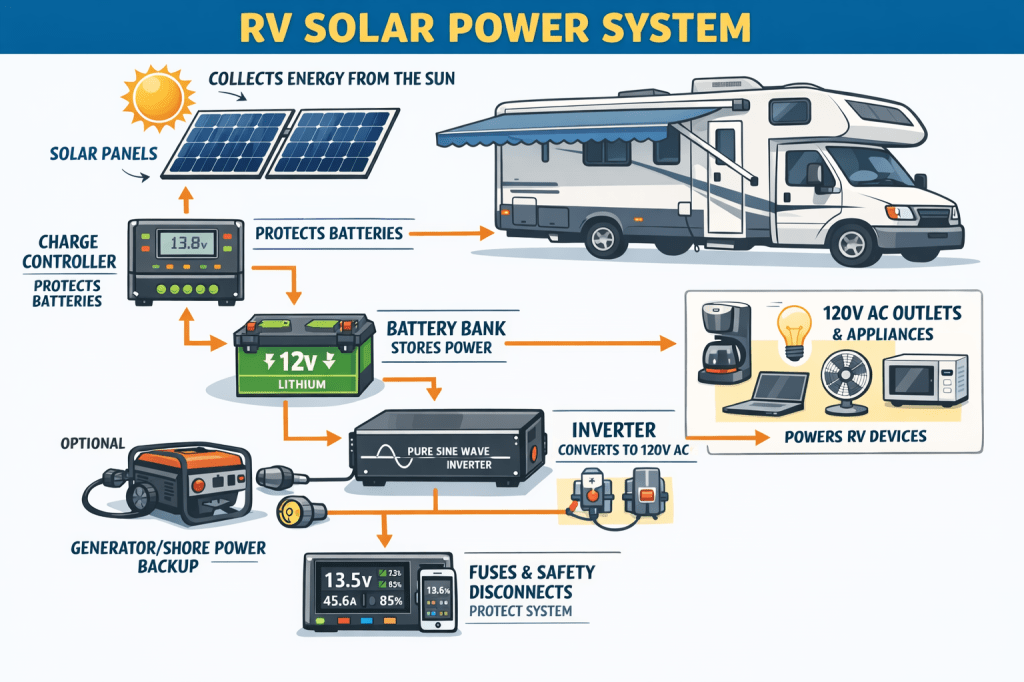
✔ Solar or generator power recommended — few hookups except dump/water points.
✔ Observe “pack it in, pack it out” — no permanent fire rings; keep area clean.
✔ Birders will find seasonal species tracking through the Colorado River corridor.


🧡 Summary

Imperial Dam LTVA is a must-visit spot for snowbirds, RVers, and desert lovers, especially in winter and spring. With affordable long-term permits, basic amenities, and spectacular Southwestern scenery, it’s one of the best desert camping areas managed by the BLM. Whether you’re boondocking for months or just passing through, this campsite offers both solitude and access to rivers, lakes, and wide-open landscapes.


Day 3065

Is 1,500 Watts of RV Solar Enough? Our Real-World Boondocking Reality

You Don’t Know What You Don’t Know: The Reality of Our Solar System

Let’s start with a simple truth:

“You don’t know what you don’t know.”

I’m not sure who first said it, but truer words have never been spoken.

I’ve been using the same basic solar diagram throughout this Solar Series because it’s a clean and simple representation of a working system. But what that diagram doesn’t show is how to track and truly understand what is actually happening inside your own solar setup.

And that’s where this post begins — the ramblings of a boondocker who realized he was walking around blind.


Boondocking Blind

Early in our boondocking life, I learned that not knowing what’s happening in your electrical system is like walking around blind. And when you walk around blind, you’re going to get bruised.

Unlike the simple diagram I’ve shared before, our system includes several additional components that allow us to monitor everything in real time.

1️⃣ Battery Monitoring System (BMS)

Think of the BMS like your vehicle’s fuel gauge.

But instead of telling you miles to empty, it tells you hours to empty.

That single piece of information changes everything.

2️⃣ Cloud-Based Dashboard Monitor

Our inverter and batteries report to a dashboard that stores data in the cloud. That allows me to analyze performance long after the fact.

3️⃣ The Excel Spreadsheet (Yes… I’m That Guy)

I track everything.

For example:

  • On January 24, 2018, the day after purchasing our Zamp 200-watt folding portable panel at the Quartzsite Big Tent RV Show, we harvested 99 amp-hours.
  • On January 25th, we harvested 79.1 amp-hours.

With data like that, you can start evaluating real system performance — not guesses.


2025 Solar Numbers at a Glance

From my Excel tracking:

  • 109,382 amp-hours harvested
  • 1,312.6 kilowatts of solar
  • 48 days with no electrical hookup
  • 41.1 hours of 7,500-watt generator runtime

From our cloud-stored data (Oct–Dec):

  • 489 kWh consumed
  • 340 kWh from shore or generator power

And this is where the cracks start to show.


Where Our System Falls Apart

Because I built our system in stages, I don’t have a complete picture.

Here’s why:

  • Solar controllers: BlueSky
  • Inverter: Victron
  • Battery bank: 600Ah Battle Born lithium
  • Roof array: 1,540 watts total

The issue?

Our Victron inverter only monitors one leg of our 50-amp system.

Why Only One Leg?

Back in 2018, we started with a 2,000-watt Heart inverter/charger. I chose BlueSky solar controllers because they squeezed maximum harvest from each panel and allowed charging adjustments down to a tenth of a volt.

Shadowing? Not a problem — I separated panels across multiple controllers.

A year later, we upgraded to a Victron 3000/120 hybrid inverter and wired it into one full leg of our coach.

To power the second leg would have required a second inverter — which seemed ridiculous at the time.

Now?

Victron makes a unit that would power both legs.

But ours doesn’t.


What We Can’t Track

The unmonitored leg includes:

  • One air conditioner
  • Electric water heater
  • Original refrigerator circuit
  • Washer/dryer

The monitored leg includes:

  • Second air conditioner
  • Microwave
  • 120V lighting
  • Almost all outlets

So we only see part of the picture.


The Reality Check

For people who thought we were serious boondockers…

We were kidding ourselves.

Winter: 50-amp hookups
Summer: 30-amp connections
Generator time: 40+ hours

Yes, we were supplementing with solar.
No, we were not living fully off-grid.

And because our inverter is hybrid, it automatically supplements shore power with batteries during high loads (microwave + toaster, for example).

In hybrid mode?

We were only harvesting around 18.6 kWh per month of solar.

That’s not off-grid living.


Exercising the Battery Bank

Last February, I made a decision:

We would start exercising our batteries.

Every night before bed, I switched the inverter to “Invert Only” mode.

That meant:

  • We ran on batteries all night.
  • Batteries discharged enough to allow full solar harvest the next day.
  • Around dinner, I switched back to “On” mode to top off.

The Results:

  • February: 7,140 amp-hours (85.7 kWh)
  • March: 131.2 kWh
  • April: 172.9 kWh
  • 100+ kWh per month since

I thought we were ready to boondock for weeks.

I was wrong.


The Hard Truth

I’ve researched.
I’ve calculated.
I’ve read everything I can get my hands on.

And the only thing I know for sure?

I still don’t know enough.


Our Current Solar Array

Roof panels:

  • 4 × 180-watt
  • 2 × 210-watt
  • 4 × 100-watt
  • Total: 1,540 watts (1.5 kW)

Controlled by:

  • 3 BlueSky MPPT controllers
  • Charging a 600Ah Battle Born lithium bank

Six panels are tiltable.
Currently, only the two 210-watt panels are tilted.

Recent harvest?

300 amp-hours per day.

And here’s the uncomfortable truth:

We are power hogs.

We like creature comforts.

I don’t want to shut down the inverter overnight.
I don’t want to give up the bed warmer on cold nights.


Peak Solar Hours vs. Daylight Hours

Peak Solar Hours (PSH) are not the same as daylight hours.

On January 6, 2026 in Baja Mexico:

  • 10.5 daylight hours
  • Just over 5 PSH

That means panels only produce at peak output for about half the day.

For comparison, in Woodstock, Ontario the same day:

  • Between 0.5 and 1.5 PSH

Location matters.

A lot.


Tilting Panels — Is It Worth It?

Yes.

Tilting panels can improve harvest by up to 45% in some conditions.

Peak power occurs when the sun hits the panel at a 90° angle — which is constantly changing throughout the day.


Crunching the Numbers

Yesterday’s harvest:

  • 287 amp-hours
  • 3,444 watt-hours (3.44 kWh)

Working backward:

3,444 ÷ 1,540 panel watts = 2.236
2.236 ÷ 3.44 PSH = 65% panel efficiency

I can crunch numbers all day long.

But the bottom line?

We need more panels.

Period.


What’s Next?

We have roof space for:

  • 2 larger panels
  • Possibly 4–6 additional 100-watt panels

That would push us beyond 2,000 watts total array size.

It will require:

  • Additional solar controllers
  • More wiring
  • More expense

But if it means more boondocking freedom?

It’s worth it.

Stay tuned — this upgrade is coming.

On a side note, my original blog was 1900 words long with long rambling paragraphs but, with the help of my AI app it is clear concise and easier to read, if you made it to here how about giving me a like!

Day 3055